
.
FOREX TECHNICAL INDICATORS ARE INEFFECTIVE AND CONFUSING
Technical indicators applied to currency pairs are complicated, confusing, and ineffective.
It has been proven that the results you get trading with off the shelf indicators are random. Indicators have an infinite number of combinations. You could spend a lifetime investigating all of the possible setting involved with over 150 technical indicators, varying the time periods and settings. But forex traders persist in their use of indicators due to lack of alternatives.
A technical indicator alone is not a trading system. Indicators are just different combinations of fibonacci, stochastics, RSI, etc. Some combinations of these are so complicated you cannot even see the price chart in the background. When retail trading commenced, the indicators arrived at same time because they were the only methods used for trading other markets, like the stock and commodities markets. But currency pairs are not constructed like stocks or commodities, they have two spearate currencies working with or against each other, so the standard technical indicators are completely ineffective. Foreign exchange traders are looking for alternatives to these tools and are ready for a simple and effective system that produces pips like The Forex Heatmap®.
The Forex Heatmap® Compared To Indicators
The trading results you will get with technical indicators has been proven to be random. This means that you will win with one trade and lose on the next. These tools may work for making a few pips if you are scalper. But this is not what traders want, they want pips, then want to ride strong trades, movements and trends as long as possible and get accurate trade entries. The Forex Heatmap® will provide traders with much more accurate entries into short term trades and into the trending pairs on the forex market. It is a simple visual map and any forex trader can learn to use it after some level of demo trading.
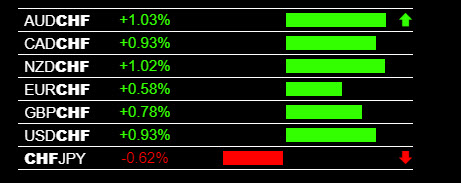
The Basis of The Forex Heatmap®
The heatmap is based on parallel and inverse analysis and individual currency strength. A simple example is that if all of the JPY pairs are dropping then the JPY is strengthening. Then if the CAD pairs show some CAD weakness you would consider a sell on the CAD/JPY. It is literally that simple and it works. You can apply this logic to 28 currency pairs and gold day after day and increase your trading accuracy. Standard forex technical indicators like fibonacci and RSI, stochastics, etc., take none of this data into consideration, and technical indicators are fundamentally flawed. The heatmap is a great real time tool for guiding your entries. Traders can move from scalping to swing and position trading 28 currency pairs using this exceptional trading tool, and your pip totals will rise. Parallel and inverse analysis works so well you can also use it for analyzing the entire forex market, along with guiding your trade entries.